Tag Archives: Programming

CPU Information

I have spent the past few weeks improving major parts of this app and I am finally at the point of releasing the new and shiny interface.

My ultimate goal for this app is to pull in all of the views into 3D and outshine other similar apps in beauty and create the best app for the job ( as usual ). This is a new beginning for the app and I will likely spend the next few months improving it.
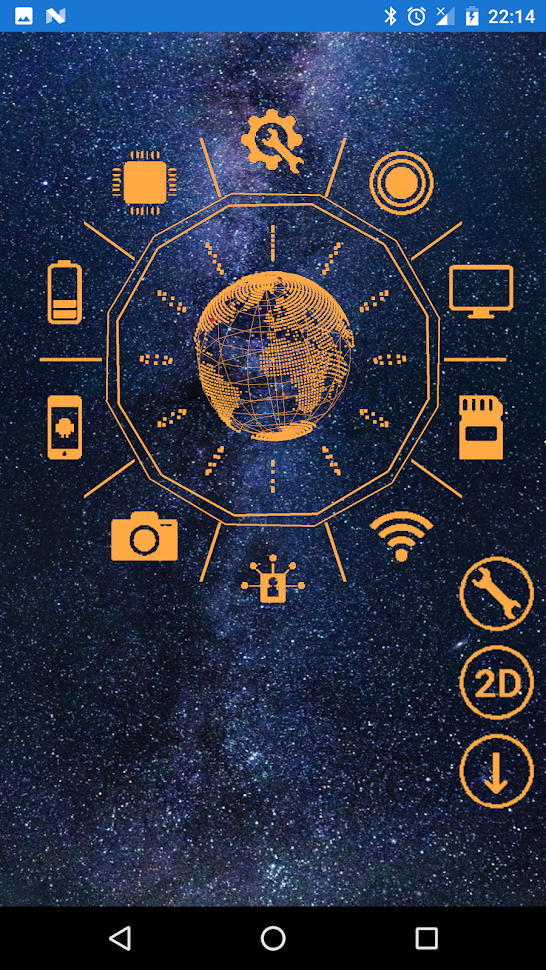
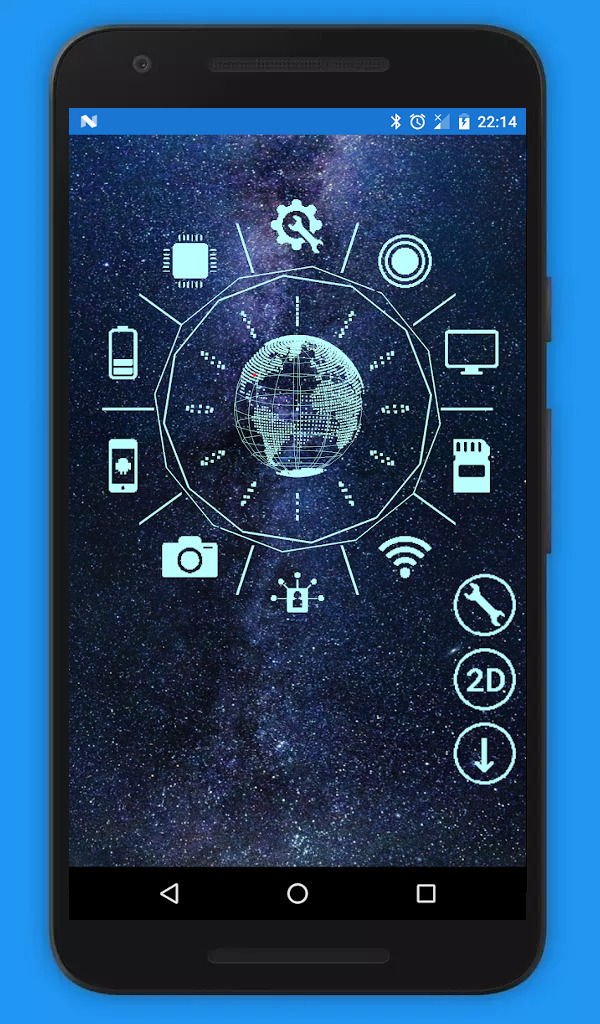
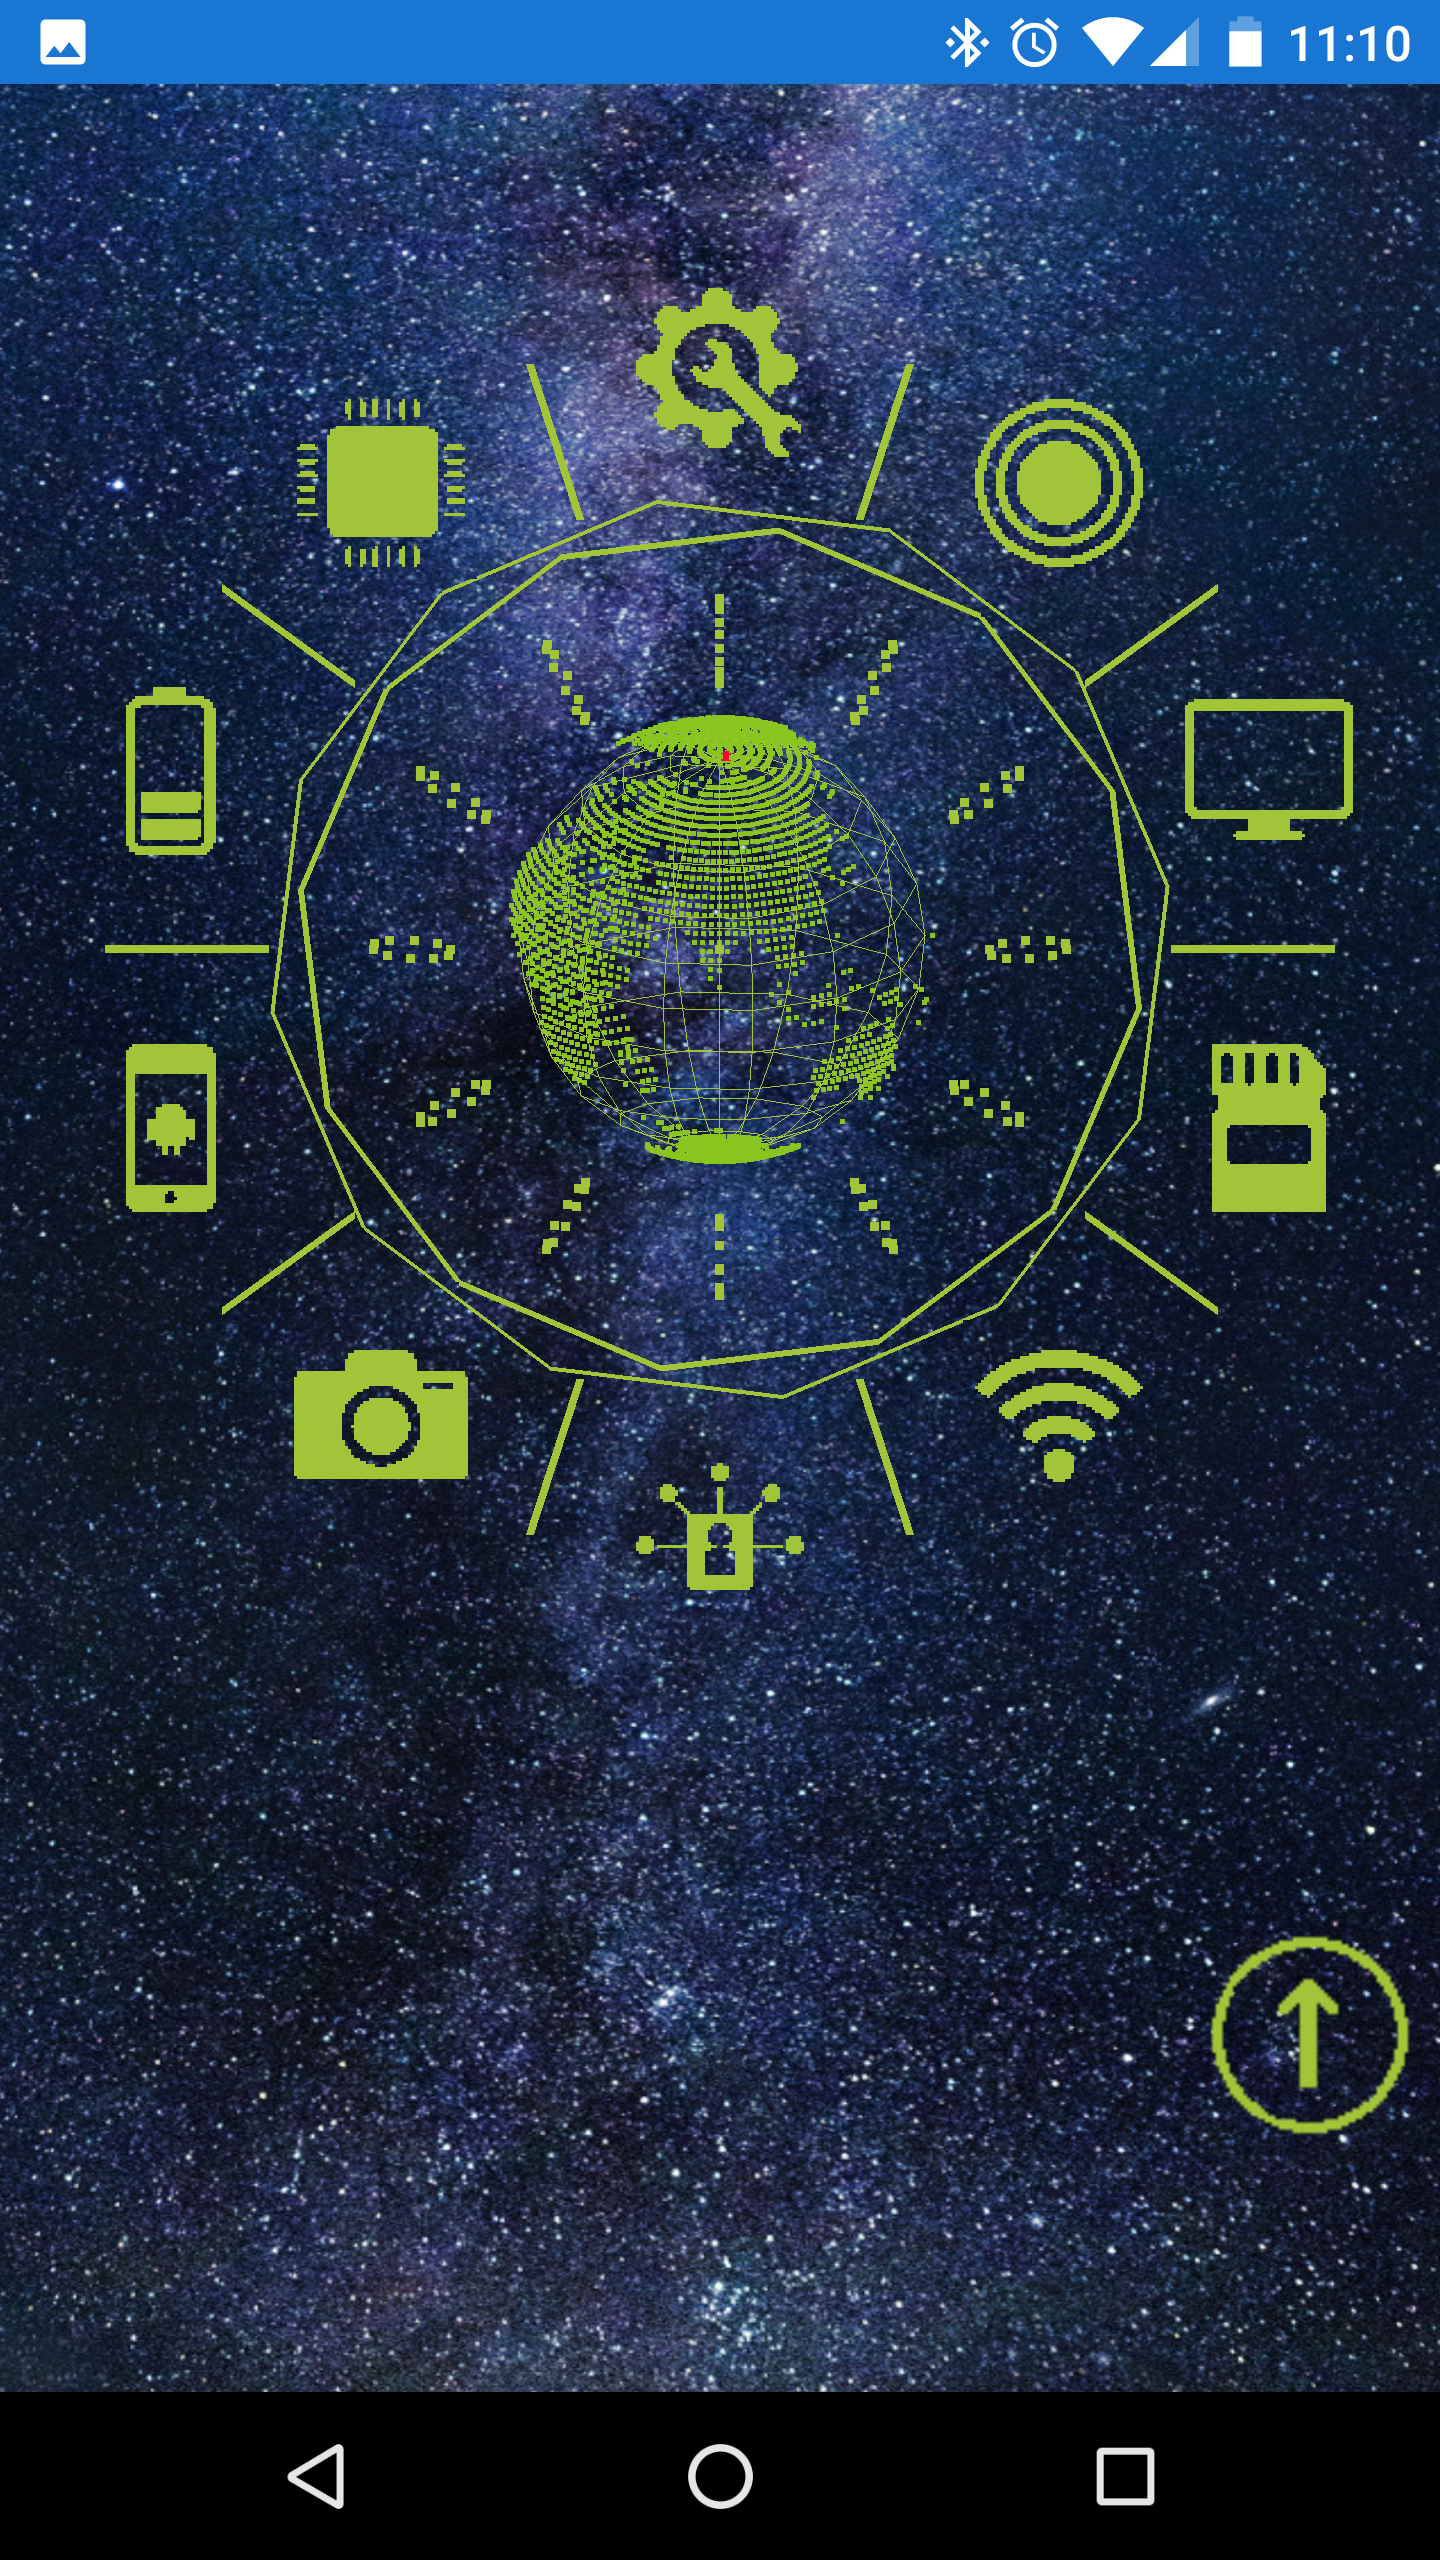
HUD

I love iron Man like HUD interfaces. As such I am building a library with multiple interfaces for different visualization purposes. The interface above is a switch-board with a connected gyroscope and the Earth centered in it.

After the initial release I want to create a terminal emulation which I can scale at will in 3D space, followed by an audio interface which coverts input from the microphone into a nice 3D visual.

There are many more possibilities and I am having fun creating these playful widgets.

Shader

Another area which I want to invest some time in is to work with some custom shaders to bring out some glowing special effects and other goodies.

OpenGL ES 2.0 is a strange beast and not necessarily the easiest environment to learn but it offers some great flexibility in what you can accomplish. The ES, which stands for Embedded Systems, introduces a few changes as compared to the desktop OpenGL implementation.

OpenGL ES 2.0 Programming guide

I am currently going through the “OpenGL ES 2.0 programming guide”, which is a real good book to learn OpenGL. It will help me to realize the remaining widgets and animations to convert the complete app into the 3D realm.

Please give it a try and let me know what you think of it. Also I would love to hear if you have any ideas for a widget which I could implement.

Get it on Google Play

Program a random password generator in QooxDoo

I have created my first video in a series of planned videos on programming in QooxDoo.

Programming in QooxDoo:

QooxDoo is a object oriented JavaScript library which allows you to create any type of widget, like List controls, Tree controls, Windows etc. Inside the browser without the need to worry about browser compatibility.

Aside from being very easy to use, this framework is fully object oriented and is better than any other framework I have seen in the past. Obviously people have their own preferences, and frameworks like jQuery, and Angular are at the top of their game. QooxDoo like other frameworks has strong parts and its weak parts.

This episode goes through some basics first before I dive into the programming part. As mentioned above I create a random password generator which you can use whenever you are asked to either create a new password or re-new your old password.

You can find the video on YouTube.

Password Generator preview

The resulting application looks like this

What I have learned from my first video tutorial:

I found that my mic is too sensitive to the higher frequency ranges and going forward I will have to either find a hardware equalizer or do some post production on the audio in software.

Since I am using Linux, my setup is all open source and freely available. As such some of the shortcomings are that Audacity is crashing once in a while, KDenlive was constantly crashing and unusable so I had to switch to OpenShot. I may give Blender’s built in NLE ( Non Linear Video Editor ) a go in a future part.

My keyboard ‘hacking’ is way to loud and will either need to find another keyboard, try to get the right filter settings to suppress it as much as possible ( without too affecting the overall audio quality too much ) or place my mic in a better spot.

Bottom line:

I had a lot of fun putting this tutorial together. I spent probably twice as much time on getting my equipment in place, and preparing AstraNOS for the link to allow people to try for themselves Here …..

The next episode will take most likely less time overall and I will also try my best to cut down the duration of the next episode to be 10 minutes or less.

I learned a ton of things and I am going to continue to learn during my next videos.

DyGraphs Pie Chart Plotter

DyGraphs is a decent Javascript library to plot time series data points.

DyGraphs plotter
DyGrpahs

I chose DyGraphs a long time ago mainly due to its small footprint of 123530 bytes for dygraph.2.0.0.min.js

One of the things it allows you to do now is to add a different plotter algorithm to plot data. One such example can be found on the demo page is that of a BarChart plotter. If you look at the code it is a fairly small addition.

One of the possible plots missing though is a PieChart. It happened that I needed a PieChart for my project and I did not want to switch to E.g. ChartJS [ Release 2.5.0 ] so I wrote my own little PieChart function for DyGraphs.

function pieChartPlotter ( e ) {
        var ctx  = e.drawingContext;
        var self = e.dygraph.user_attrs_.myCtx;
        var itm, nme, data = self._pieData;
        if ( ! data )  {
          var t, i, y, all, total = 0;
          data = {};
          all = e.allSeriesPoints; // array of array
          for ( t=0; t

The one thing you will see in this code is that I calculate the required PieChart data once and then check for its existance each time I enter this function. This is requried beause DyGraph does currently not call the plotter function in a context but rather in the global browser context ( I.e. the this object is the browser Window ).

So instead I ‘added’ ( read hacked ) myCtx to the dygraphs – plotter options to gain access to my local JavaScript object where I buffer the _pieData.

DyGraphs Pie Chart plotter

While this may not be the nicest pie chart around, it is a small, basic function which can be expanded on fairly easily.

Addendum: Here is how to use this code

    this._options  = {
      labels: ["Date","Count"],
      legend: 'always',
      title:  "  ",
      myCtx: this,
      animatedZooms: true,
      hideOverlayOnMouseOut: false,
      stackedGraph: false,
      clickCallback    : this.onGraphClicked,
      showRangeSelector: true,
      underlayCallback : this.highlightWeekend,
      legendFormatter  : this.legendFormatter,
      highlightSeriesOpts : {
        strokeWidth: 3,
        strokeBorderWidth: 1,
        highlightCircleSize: 5
      }
    };
    this._chart = new Dygraph ( dom, this._data.data, this._options );
    ...